Market Outlook
January 06, 2017
Market Cues
Domestic Indices
Chg (%)
(Pts)
(Close)
Indian markets are likely to open flat with a positive bias tracking SGX Nifty and
BSE Sensex
0.9
245
26,878
global cues.
Nifty
1.0
83
8,274
The US market started the New Year with a positive bias, but the momentum seems
Mid Cap
1.3
161
12,356
to be losing ground. Initially the markets lacked direction on Thursday but started
Small Cap
1.0
121
12,493
trending down during the day. The US labor department will release its monthly job
data today and hence traders might have avoided large positions, resulting in a
Bankex
1.4
276
20,722
subdued market.
European markets remained in a range bound trade during the day. The minutes of
Global Indices
Chg (%)
(Pts)
(Close)
US fed was published after the closing of the European market yesterday and hence
Dow Jones
(0.2)
(43)
19,899
the European markets reacted positively initially but closed almost flattish for the
Nasdaq
0.2
11
5,488
day.
FTSE
0.1
06
7,195
Indian markets rallied on Thursday and broad based buying was witnessed across
Nikkei
(0.4)
(73)
19,521
sector. Opinion poll conducted by a leading media groups indicated a positive
Hang Seng
1.5
322
22,457
surprise and chances of BJP wining the UP elections which fuelled expectations of
Shanghai Com
0.2
7
3,165
more reforms and markets reacted positively. Further the Union Finance Minister Mr
Jiatley also expressed his confidence that both direct and indirect tax collections will
surpass the budget estimates which further acted as a catalyst for market move.
Advances / Declines
BSE
NSE
Advances
1,979
1,185
News Analysis
Declines
891
433
Projects in road, shipping sector to cross over Rs 6 lakh cr by March 2017.
Unchanged
132
84
Detailed analysis on Pg2
Investor’s Ready Reckoner
Volumes (` Cr)
Key Domestic & Global Indicators
BSE
3,151
Stock Watch: Latest investment recommendations on 150+ stocks
NSE
19,021
Refer Pg5 onwards
Net Inflows (` Cr)
Net
Mtd
Ytd
Top Picks
CMP
Target
Upside
FII
(553)
(901)
(901)
Company
Sector
Rating
(`)
(`)
(%)
MFs
365
481
481
Amara Raja Batteries Auto & Auto Ancillary
Buy
916
1,167
27.4
Alkem Laboratories
Pharmaceuticals
Buy
1,662
1,989
19.7
HCL Tech
IT
Buy
844
1,000
18.5
Top Gainers
Price (`)
Chg (%)
Power Grid Corp.
Power
Buy
191
223
16.9
Justdial
394
14.8
Navkar Corp.
Others
Buy
174
265
52.4
Jpassociat
11
7.9
More Top Picks on Pg3
Jswsteel
176
7.8
Key Upcoming Events
Unitech
5
7.0
Previous
Consensus
Date
Region
Event Description
Gmdcltd
101
6.2
Reading
Expectations
Jan 06 Euro Zone Euro Zone Consumer Confidence
(5.1)
(5.1)
Jan 06 US
Unemployment rate
4.6
4.7
Top Losers
Price (`)
Chg (%)
Jan 06 China
Consumer Price Index (YoY)
2.3
2.2
Cholafin
930
(3.3)
Jan 10 India
Imports YoY %
10.4
--
Shriramcit
1,815
(2.9)
Jan 10 UK
Industrial Production (YoY)
(1.1)
--
Techm
488
(2.3)
More Events on Pg4
Fortis
185
(2.2)
Sanofi
4,200
(2.1)
As on January 05, 2017
Market Outlook
January 06, 2017
News Analysis
Projects in road, shipping sector to cross over `6 lakh cr by March 2017
In a media interaction the union minister for Roads & Shipping Mr Nitin Gadkari
said that, the Government has allocated `4.6 lakahs crores for the roads and
shipping projects across the country. As per the minister the Govt is highly focused
on improving the infrastructure in India and said the ministry would allot 15,000
km of road projects by March 2017 and the total allocation in the sector would go
upto `6 lakhs crores. The Govt aims to construct 17.13km road per day.
Over the last few years the Govt has adopted the Hybrid annuity model compared
to the conventional models so that more and more projects get executed faster.
Further to accelerate the ongoing project the Ministry of Road is asking the Union
Govt for allocating higher funds in the upcoming budget. The ministry wants a
higher allocation of `90,000 in the budget 2017-18 for the purpose. A higher
allocation will benefit the EPC contractors involved in the projects as well as
improve the demand for key inputs like cement and steel.
Economic and Political News
PSBs to have more attractive pay packages, says the Bank Board Bureau chief
Mr Vindo Rai
Govt planning to collect road toll digitally by March
Bill targeting H1B visas reintroduced in US
India’s solar capacity may double to 18MW this year
Corporate News
Bank Of Baroda reduces MCLR based lending rates by up to 75 bps
Demonetization didn’t take a toll on the company says IRB Infra
Piramal Enterprises Ltd has said that its subsidiary Piramal Finance Ltd will
apply to the NHB to incorporate a housing finance company.
Monnet Ispat’s lenders restart stake sale process
Market Outlook
January 06, 2017
Top Picks ★★★★★
Large Cap
Market Cap
CMP
Target
Upside
Company
Rationale
(` Cr)
(`)
(`)
(%)
To outpace battery industry growth due to better
Amara Raja Batteries
15,652
916
1,167
27.4
technological products leading to market share gains in both
the automotive OEM and replacement segments.
Strong growth in domestic business due to its leadership in
Alkem Laboratories
19,871
1,662
1,989
19.7
acute therapeutic segment. Alkem expects to launch more
products in USA, which bodes for its international business.
The stock is trading at attractive valuations and is factoring all
HCL Tech
1,19,116
844
1,000
18.5
the bad news.
Back on the growth trend, expect a long term growth of 14%
Infosys
2,28,868
996
1,249
25.3
to be a US$20bn in FY2020.
Strong order backlog and improvement in execution would
Larsen & Toubro
1,30,011
1,394
1,634
17.2
trigger the growth for the L&T
One of the largest pharma companies with strong
Lupin
68,215
1,511
1,809
19.7
international presence. It has a rich pipeline of ANDAs which
is also one of the largest among the generic companies.
Going forward, we expect the company to report strong top-
Power Grid Corporation
99,819
191
223
16.9
line CAGR of ~16% and bottom-line CAGR of ~19% over
FY16-18 on back of strong capitalization guidance
Source: Company, Angel Research
Mid Cap
Market Cap
CMP
Target
Upside
Company
Rationale
(` Cr)
(`)
(`)
(%)
We expect the company would report strong profitability
Asian Granito
729
242
351
44.9
owing to better product mix, higher B2C sales and
amalgamation synergy.
Among the top 4 players in the consumer durables segment.
Bajaj Electricals
2,348
232
274
18.0
Improved profitability backed by turn around in E&P segment.
Strong order book lends earnings visibility.
Favourable outlook for the AC industry to augur well for
Cooling products business which is out pacing the market
Blue Star
4,700
492
634
28.9
growth. EMPPAC division's profitability to improve once
operating environment turns around.
With a focus on the low and medium income (LMI) consumer
Dewan Housing Finance
7,748
247
350
41.4
segment, the company has increased its presence in tier-II &
III cities where the growth opportunity is immense.
Strong loan growth backed by diversified loan portfolio and
Equitas Holdings
5,034
150
235
56.6
adequate CAR. ROE & ROA likely to remain decent as risk of
dilution remains low. Attractive valuations considering growth.
Economic recovery to have favourable impact on advertising
& circulation revenue growth. Further, the acquisition of a
Jagran Prakashan
5,799
177
225
26.8
radio business (Radio City) would also boost the company's
revenue growth.
High order book execution in EPC segment, rising B2C sales
KEI Industries
981
126
153
21.4
and higher exports to boost the revenues and profitability
Speedier execution and speedier sales, strong revenue visibilty
Mahindra Lifespace
1,485
362
522
44.3
in short-to-long run, attractive valuations
Higher growth in domestic branded sales and healthy export
Mirza International
1,117
93
107
15.2
to boost the profitability.
Massive capacity expansion along with rail advantage at ICD
Navkar Corporation
2,480
174
265
52.4
as well CFS augurs well for the company
Strong brands and distribution network would boost growth
Siyaram Silk Mills
1,312
1,400
1,605
14.6
going ahead. Stock currently trades at an inexpensive
valuation.
Market leadership in Hindi news genre and no. 2 viewership
ranking in English news genre, exit from the radio business,
TV Today Network
1,688
283
385
36.1
and anticipated growth in ad spends by corporates to benefit
the stock.
Source: Company, Angel Research
Market Outlook
January 06, 2017
Key Upcoming Events
Global economic events release calendar
Bloomberg Data
Date
Time
Country
Event Description
Unit
Period
Last Reported
Estimated
Jan 06, 2017
3:30 PM
Euro Zone
Euro-Zone Consumer Confidence
Value
Dec F
(5.10)
(5.10)
7:00 PM
US
Unnemployment rate
%
Dec
4.60
4.70
7:00 PM
US
Change in Nonfarm payrolls
Thousands
Dec
178.00
180.00
Jan 10, 2017
7:00 AM
China
Consumer Price Index (YoY)
% Change
Dec
2.30
2.20
3:00 PM
UK
Industrial Production (YoY)
% Change
Nov
(1.10)
India
Imports YoY%
% Change
Dec
10.40
Jan 11, 2017
India
Exports YoY%
% Change
Dec
2.30
Jan 12, 2017
5:30 PM
India
Industrial Production YoY
% Change
Nov
(1.90)
Jan 13, 2017
China
Exports YoY%
% Change
Dec
(1.60)
(4.00)
US
Producer Price Index (mom)
% Change
Dec
-
Jan 16, 2017
12:00 PM
India
Monthly Wholesale Prices YoY%
% Change
Dec
3.15
Jan 17, 2017
3:00 PM
UK
CPI (YoY)
% Change
Dec
1.20
Jan 18, 2017
7:00 PM
US
Consumer price index (mom)
% Change
Dec
0.20
3:30 PM
Euro Zone
Euro-Zone CPI (YoY)
%
Dec F
1.10
3:00 PM
UK
Jobless claims change
% Change
Dec
2.40
7:45 PM
US
Industrial Production
%
Dec
(0.44)
Jan 19, 2017
7:00 PM
US
Building permits
Thousands
Dec
1,212.00
7:00 PM
US
Housing Starts
Thousands
Dec
1,090.00
6:15 PM
Euro Zone
ECB announces interest rates
%
Jan 19
-
Jan 20, 2017
7:30 AM
China
Industrial Production (YoY)
% Change
Dec
6.20
7:30 AM
China
Real GDP (YoY)
% Change
4Q
6.70
Jan 24, 2017
2:00 PM
Germany
PMI Services
Value
Jan P
54.30
8:30 PM
US
Existing home sales
Million
Dec
5.61
2:00 PM
Germany
PMI Manufacturing
Value
Jan P
55.60
Jan 26, 2017
3:00 PM
UK
GDP (YoY)
% Change
4Q A
2.20
Source: Bloomberg, Angel Research
Market Outlook
January 06, 2017
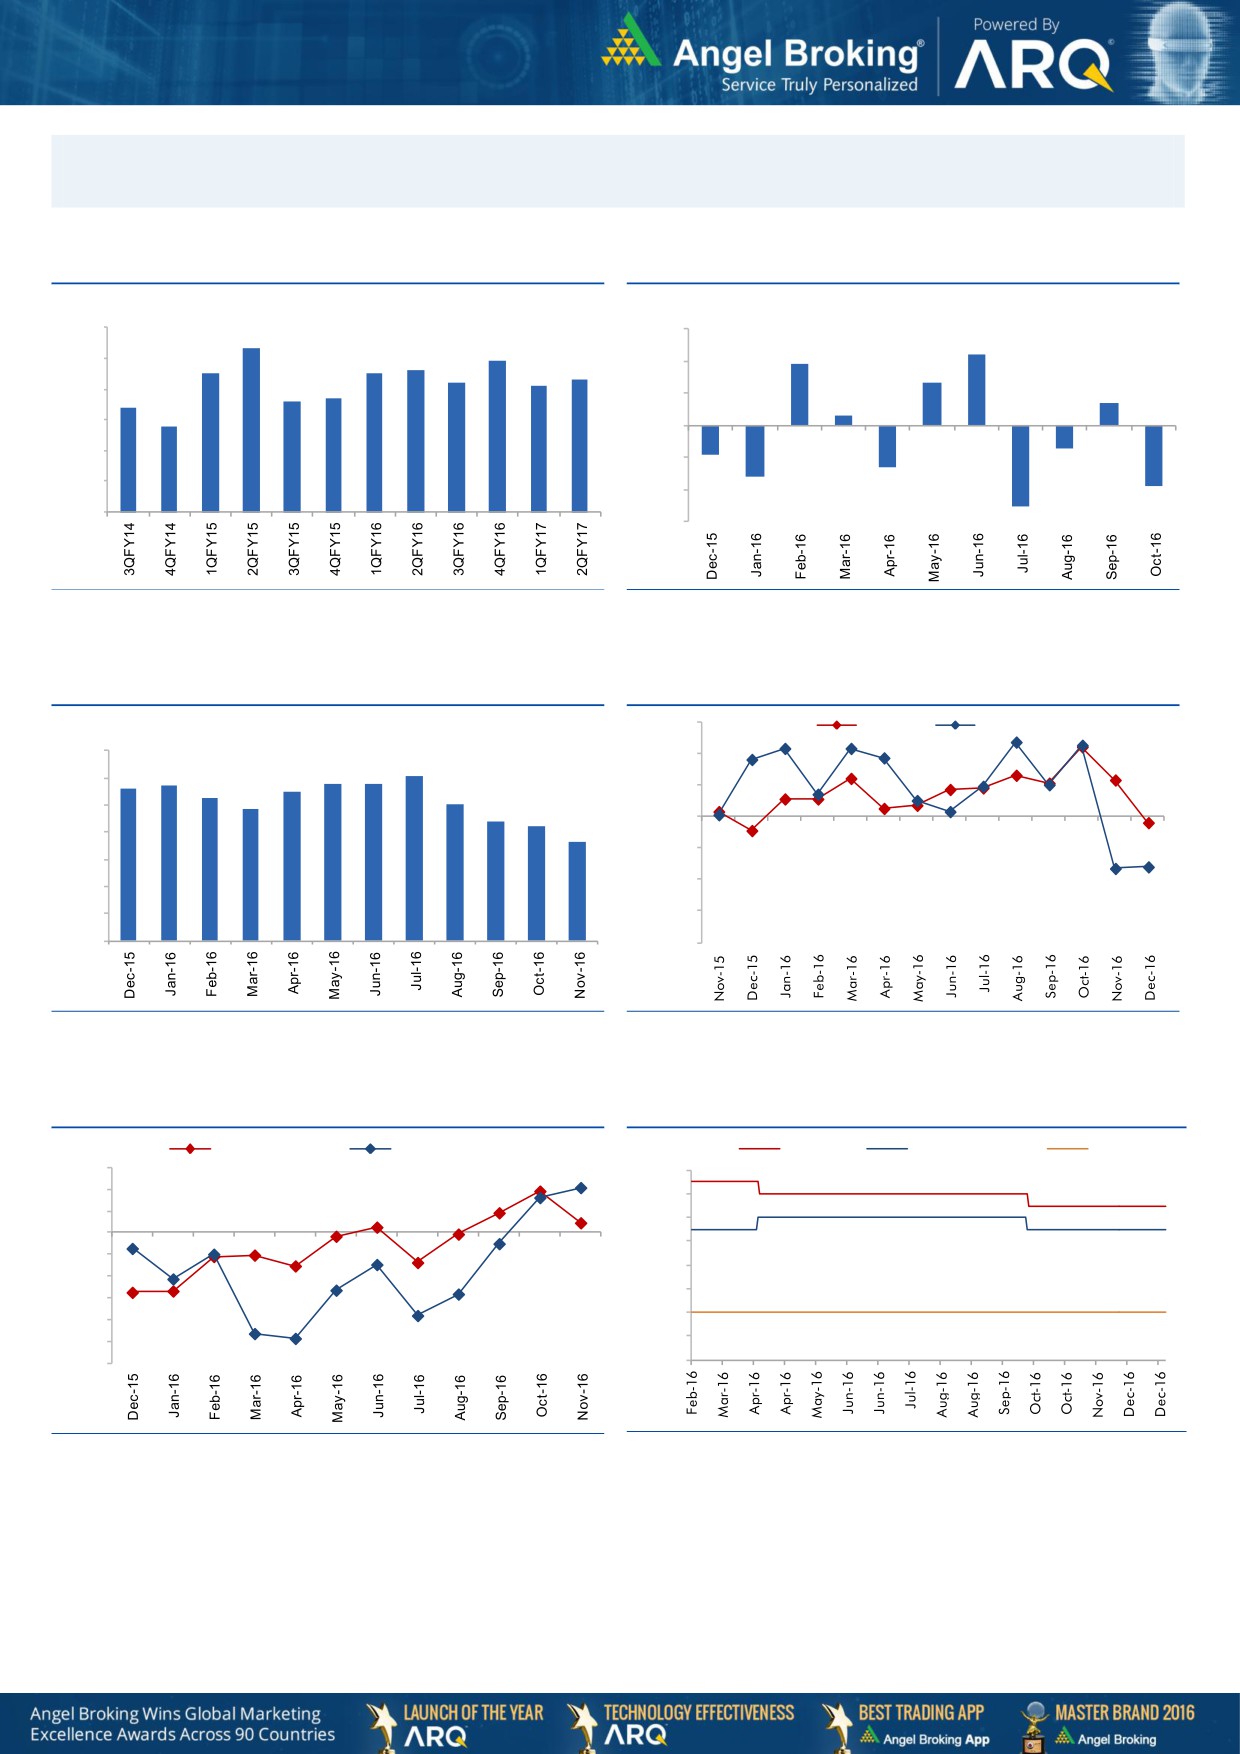
Macro watch
Exhibit 1: Quarterly GDP trends
Exhibit 2: IIP trends
(%)
(%)
9.0
8.3
3.0
2.2
7.9
1.9
7.5
7.5
7.6
8.0
7.3
2.0
7.2
7.1
1.3
6.6
6.7
0.7
7.0
6.4
1.0
0.3
5.8
6.0
-
5.0
(1.0)
(0.7)
(0.9)
4.0
(1.3)
(2.0)
(1.6)
(1.9)
3.0
(3.0)
(2.5)
Source: CSO, Angel Research
Source: MOSPI, Angel Research
Exhibit 3: Monthly CPI inflation trends
Exhibit 4: Manufacturing and services PMI
56.0
Mfg. PMI
Services PMI
(%)
7.0
54.0
6.1
5.6
5.7
5.8
5.8
6.0
5.3
5.5
5.1
52.0
4.8
5.0
4.4
4.2
50.0
3.6
4.0
48.0
3.0
46.0
2.0
1.0
44.0
-
42.0
Source: MOSPI, Angel Research
Source: Market, Angel Research; Note: Level above 50 indicates expansion
Exhibit 5: Exports and imports growth trends
Exhibit 6: Key policy rates
(%)
Exports yoy growth
Imports yoy growth
(%)
Repo rate
Reverse Repo rate
CRR
15.0
7.00
10.0
6.50
5.0
6.00
0.0
5.50
(5.0)
5.00
(10.0)
4.50
(15.0)
4.00
(20.0)
(25.0)
3.50
(30.0)
3.00
Source: Bloomberg, Angel Research
Source: RBI, Angel Research
Market Outlook
January 06, 2017
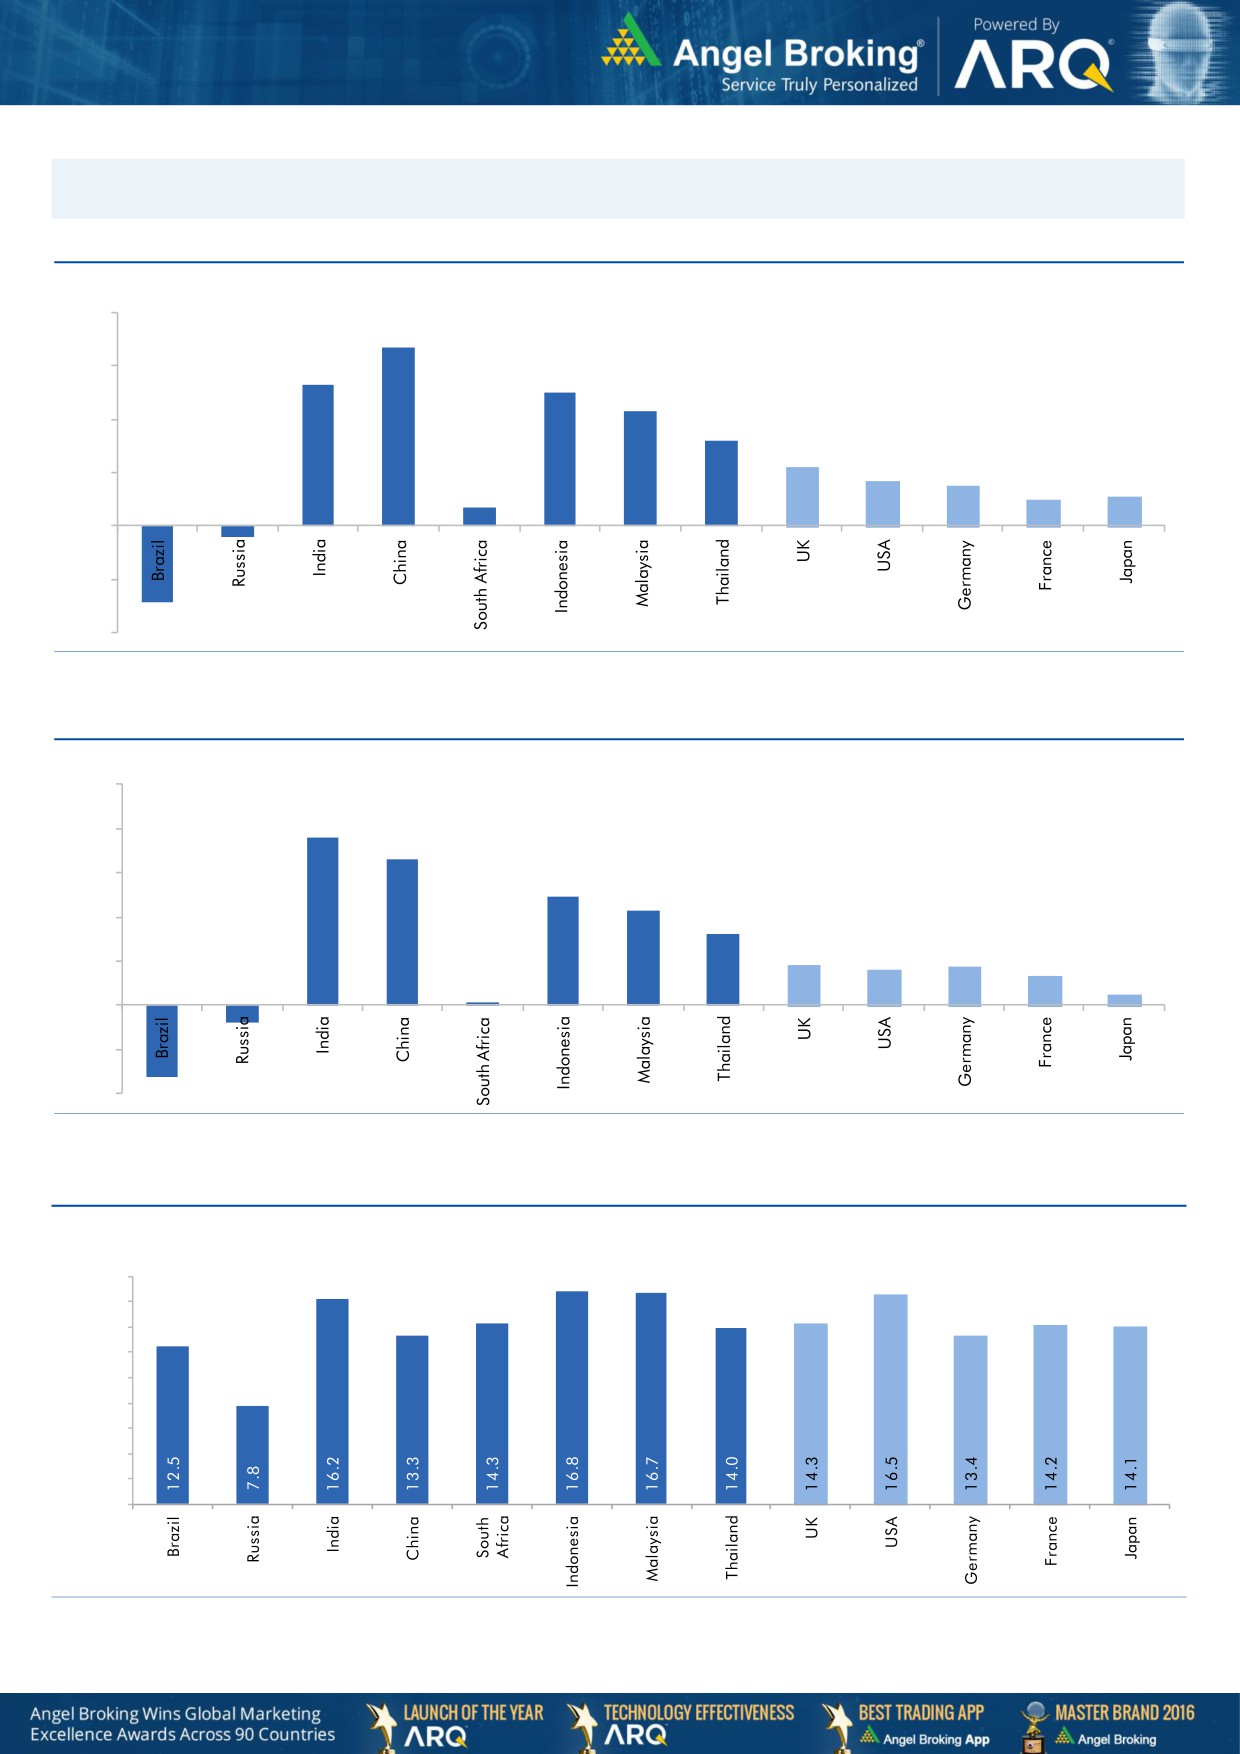
Global watch
Exhibit 1: Latest quarterly GDP Growth (%, yoy) across select developing and developed countries
(%)
8.0
6.7
5.3
6.0
5.0
0.7
4.3
4.0
3.2
2.2
1.7
2.0
1.5
1.0
1.1
-
(2.0)
(0.4)
(2.9)
(4.0)
Source: Bloomberg, Angel Research
Exhibit 2: 2016 GDP Growth projection by IMF (%, yoy) across select developing and developed countries
(%)
10.0
7.6
8.0
6.6
6.0
4.9
4.3
4.0
3.2
1.8
1.6
1.7
2.0
1.3
(0.8)
0.5
(3.3)
0.1
-
(2.0)
(4.0)
Source: IMF, Angel Research
Exhibit 3: One year forward P-E ratio across select developing and developed countries
s
(x)
18.0
16.0
14.0
12.0
10.0
8.0
6.0
4.0
2.0
-
Source: IMF, Angel Research
Market Outlook
January 06, 2017
Exhibit 4: Relative performance of indices across globe
Returns (%)
Country
Name of index
Closing price
1M
3M
1YR
Brazil
Bovespa
62,071
3.7
4.4
46.3
Russia
Micex
2,220
2.9
12.4
27.0
India
Nifty
8,274
1.6
(5.6)
4.1
China
Shanghai Composite
3,165
(1.2)
5.2
(10.5)
South Africa
Top 40
43,682
(0.0)
(3.2)
(1.7)
Mexico
Mexbol
46,720
4.0
(2.5)
16.0
Indonesia
LQ45
897
1.7
(4.3)
13.7
Malaysia
KLCI
1,660
2.1
(0.1)
(1.5)
Thailand
SET 50
986
4.5
4.4
21.6
USA
Dow Jones
19,899
3.8
9.5
20.5
UK
FTSE
7,195
6.6
1.7
21.7
Japan
Nikkei
19,521
5.4
16.9
3.9
Germany
DAX
11,585
8.4
9.6
16.3
France
CAC
4,901
7.1
9.4
16.4
Source: Bloomberg, Angel Research
Stock Watch
January 06, 2017
Company Name
Reco
CMP
Target
Mkt Cap
Sales ( Čcr )
OPM(%)
EPS (Č)
PER(x)
P/BV(x)
RoE(%)
EV/Sales(x)
(Č)
Price ( Č)
( Č cr )
FY17E FY18E
FY17E
FY18E
FY17E
FY18E
FY17E
FY18E
FY17E
FY18E
FY17E
FY18E
FY17E
FY18E
Agri / Agri Chemical
Rallis
Neutral
204
-
3,964
1,937
2,164
13.3
14.3
9.0
11.0
22.7
18.5
3.9
3.4
18.4
19.8
2.1
1.8
United Phosphorus
Neutral
674
-
34,181
15,176
17,604
18.5
18.5
37.4
44.6
18.0
15.1
3.5
2.9
21.4
21.2
2.4
2.0
Auto & Auto Ancillary
Ashok Leyland
Buy
84
111
23,891
22,407
26,022
10.6
10.6
5.2
6.4
16.1
13.1
3.6
3.1
23.6
24.7
1.1
1.0
Bajaj Auto
Neutral
2,721
-
78,735
25,093
27,891
19.5
19.2
143.9
162.5
18.9
16.8
5.3
4.6
30.3
29.4
2.9
2.5
Bharat Forge
Neutral
922
-
21,466
7,726
8,713
20.5
21.2
35.3
42.7
26.1
21.6
4.8
4.4
18.9
20.1
2.8
2.5
Eicher Motors
Neutral
22,324
-
60,730
16,583
20,447
17.5
18.0
598.0
745.2
37.3
30.0
12.8
9.7
41.2
38.3
3.5
2.8
Gabriel India
Buy
109
130
1,563
1,544
1,715
9.0
9.3
5.4
6.3
20.2
17.3
3.8
3.4
18.9
19.5
1.0
0.9
Hero Motocorp
Buy
3,072
3,541
61,351
30,958
34,139
15.7
15.7
193.6
208.3
15.9
14.8
6.2
5.1
34.2
30.5
1.8
1.6
Jamna Auto Industries Neutral
187
-
1,488
1,486
1,620
9.8
9.9
15.0
17.2
12.5
10.9
2.7
2.3
21.8
21.3
1.1
1.0
L G Balakrishnan & Bros Neutral
596
-
935
1,302
1,432
11.6
11.9
43.7
53.0
13.6
11.2
1.9
1.8
13.8
14.2
0.8
0.7
Mahindra and Mahindra Neutral
1,226
-
76,143
46,534
53,077
11.6
11.7
67.3
78.1
18.2
15.7
3.0
2.6
15.4
15.8
1.6
1.4
Maruti
Accumulate
5,635
6,006
170,227
68,057
82,958
15.8
15.5
212.1
261.2
26.6
21.6
5.3
4.4
19.8
20.3
2.2
1.7
Minda Industries
Neutral
326
-
2,586
2,728
3,042
9.0
9.1
68.2
86.2
4.8
3.8
1.1
0.9
23.8
24.3
1.0
0.9
Motherson Sumi
Neutral
328
-
46,095
45,896
53,687
7.8
8.3
13.0
16.1
25.2
20.4
8.1
6.5
34.7
35.4
1.1
0.9
Rane Brake Lining
Neutral
1,005
-
796
511
562
11.3
11.5
28.1
30.9
35.8
32.5
5.5
5.0
15.3
15.0
1.7
1.6
Setco Automotive
Neutral
37
-
493
741
837
13.0
13.0
15.2
17.0
2.4
2.2
0.4
0.4
15.8
16.3
1.1
1.0
Tata Motors
Neutral
502
-
144,923
300,209
338,549
8.9
8.4
42.7
54.3
11.8
9.3
1.9
1.6
15.6
17.2
0.6
0.5
TVS Motor
Neutral
385
-
18,279
13,390
15,948
6.9
7.1
12.8
16.5
30.2
23.3
7.5
5.9
26.3
27.2
1.4
1.2
Amara Raja Batteries
Buy
916
1,167
15,652
5,504
6,605
17.6
17.5
33.4
40.9
27.4
22.4
6.1
4.9
22.1
22.0
2.8
2.4
Exide Industries
Neutral
184
-
15,670
7,439
8,307
15.0
15.0
8.1
9.3
22.8
19.8
3.2
2.8
14.3
16.7
1.7
1.5
Apollo Tyres
Buy
188
235
9,557
12,877
14,504
14.3
13.9
21.4
23.0
8.8
8.2
1.4
1.2
16.4
15.2
0.9
0.8
Ceat
Buy
1,192
1,450
4,823
7,524
8,624
13.0
12.7
131.1
144.3
9.1
8.3
1.7
1.4
19.8
18.6
0.7
0.6
JK Tyres
Neutral
117
-
2,645
7,455
8,056
15.0
15.0
21.8
24.5
5.4
4.8
1.1
0.9
22.8
21.3
0.5
0.4
Swaraj Engines
Neutral
1,350
-
1,677
660
810
15.2
16.4
54.5
72.8
24.8
18.6
7.7
7.0
31.5
39.2
2.4
1.9
Subros
Neutral
170
-
1,017
1,488
1,681
11.7
11.9
6.4
7.2
26.5
23.7
2.8
2.5
10.8
11.4
0.9
0.8
Indag Rubber
Neutral
182
-
478
286
326
19.8
16.8
11.7
13.3
15.6
13.7
2.6
2.5
17.8
17.1
1.3
1.2
Capital Goods
ACE
Neutral
48
-
472
709
814
4.1
4.6
1.4
2.1
34.1
22.7
1.4
1.3
4.4
6.0
0.8
0.7
BEML
Neutral
1,000
-
4,162
3,451
4,055
6.3
9.2
31.4
57.9
31.8
17.3
1.9
1.7
6.3
10.9
1.3
1.1
Bharat Electronics
Neutral
1,432
-
31,980
8,137
9,169
16.8
17.2
58.7
62.5
24.4
22.9
3.8
3.4
44.6
46.3
2.9
2.6
Stock Watch
January 06, 2017
Company Name
Reco
CMP
Target
Mkt Cap
Sales ( Čcr )
OPM(%)
EPS (Č)
PER(x)
P/BV(x)
RoE(%)
EV/Sales(x)
(Č)
Price ( Č)
( Č cr )
FY17E
FY18E
FY17E
FY18E
FY17E
FY18E
FY17E
FY18E
FY17E
FY18E
FY17E
FY18E
FY17E
FY18E
Capital Goods
Voltas
Buy
343
407
11,349
6,511
7,514
7.9
8.7
12.9
16.3
26.6
21.0
4.8
4.2
16.7
18.5
1.5
1.3
BGR Energy
Neutral
124
-
898
16,567
33,848
6.0
5.6
7.8
5.9
16.0
21.1
0.9
0.9
4.7
4.2
0.2
0.1
BHEL
Neutral
128
-
31,293
28,797
34,742
-
2.8
2.3
6.9
55.6
18.5
0.9
0.9
1.3
4.8
0.7
0.5
Blue Star
Buy
492
634
4,700
4,283
5,077
5.9
7.3
14.9
22.1
33.1
22.2
6.4
5.4
20.4
26.4
1.1
1.0
Crompton Greaves
Neutral
62
-
3,880
5,777
6,120
5.9
7.0
3.3
4.5
18.8
13.8
0.8
0.8
4.4
5.9
0.6
0.5
Greaves Cotton
Neutral
123
-
3,006
1,755
1,881
16.8
16.9
7.8
8.5
15.8
14.5
3.2
2.9
20.6
20.9
1.4
1.3
Inox Wind
Neutral
185
-
4,105
5,605
6,267
15.7
16.4
24.8
30.0
7.5
6.2
2.1
1.5
25.9
24.4
0.8
0.6
KEC International
Neutral
146
-
3,744
9,294
10,186
7.9
8.1
9.9
11.9
14.7
12.2
2.2
1.9
15.6
16.3
0.6
0.6
KEI Industries
Buy
126
153
981
2,574
2,921
10.4
10.0
10.1
11.8
12.5
10.7
2.2
1.9
17.7
17.4
0.6
0.5
Thermax
Neutral
808
-
9,632
5,421
5,940
7.3
7.3
25.7
30.2
31.5
26.8
3.8
3.5
12.2
13.1
1.7
1.5
VATech Wabag
Buy
480
681
2,617
3,136
3,845
8.9
9.1
26.0
35.9
18.5
13.4
2.3
2.0
13.4
15.9
0.7
0.6
Cement
ACC
Neutral
1,333
-
25,033
11,225
13,172
13.2
16.9
44.5
75.5
30.0
17.7
2.8
2.6
11.2
14.2
2.2
1.9
Ambuja Cements
Neutral
214
-
42,552
9,350
10,979
18.2
22.5
5.8
9.5
37.0
22.6
3.1
2.8
10.2
12.5
4.6
3.9
India Cements
Neutral
126
-
3,869
4,364
4,997
18.5
19.2
7.9
11.3
15.9
11.2
1.2
1.1
8.0
8.5
1.6
1.4
JK Cement
Neutral
729
-
5,096
4,398
5,173
15.5
17.5
31.2
55.5
23.4
13.1
2.8
2.4
12.0
15.5
1.7
1.4
J K Lakshmi Cement
Buy
362
565
4,257
2,913
3,412
14.5
19.5
7.5
22.5
48.2
16.1
3.0
2.5
12.5
18.0
2.0
1.7
Orient Cement
Buy
128
215
2,613
2,114
2,558
18.5
20.5
8.1
11.3
15.8
11.3
2.3
2.0
9.0
14.0
1.9
1.4
UltraTech Cement
Neutral
3,380
-
92,774
25,768
30,385
21.0
23.5
111.0
160.0
30.5
21.1
3.9
3.4
13.5
15.8
3.7
3.1
Construction
ITNL
Neutral
114
-
3,745
8,946
10,017
31.0
31.6
8.1
9.1
14.1
12.5
0.5
0.5
4.2
5.0
3.8
3.5
KNR Constructions
Neutral
169
-
2,381
1,385
1,673
14.7
14.0
41.2
48.5
4.1
3.5
0.8
0.7
14.9
15.2
1.8
1.5
Larsen & Toubro
Buy
1,394
1,634
130,011
111,017
124,908
11.0
11.0
61.1
66.7
22.8
20.9
2.7
2.5
13.1
12.9
2.2
2.0
Gujarat Pipavav Port
Neutral
132
-
6,393
705
788
52.2
51.7
5.0
5.6
26.5
23.6
2.6
2.3
11.2
11.2
8.7
7.3
Nagarjuna Const.
Neutral
86
-
4,795
8,842
9,775
9.1
8.8
5.3
6.4
16.3
13.5
1.3
1.2
8.2
9.1
0.7
0.6
PNC Infratech
Buy
105
143
2,683
2,350
2,904
13.1
13.2
9.0
8.8
11.6
11.9
0.4
0.4
15.9
13.9
1.3
1.0
Simplex Infra
Neutral
288
-
1,425
6,829
7,954
10.5
10.5
31.4
37.4
9.2
7.7
1.0
0.9
9.9
13.4
0.6
0.5
Power Mech Projects
Neutral
435
-
640
1,801
2,219
12.7
14.6
72.1
113.9
6.0
3.8
1.1
0.9
16.8
11.9
0.4
0.3
Sadbhav Engineering
Accumulate
274
298
4,700
3,598
4,140
10.3
10.6
9.0
11.9
30.4
23.0
3.2
2.8
9.9
11.9
1.6
1.4
NBCC
Neutral
250
-
14,976
7,428
9,549
7.9
8.6
8.2
11.0
30.4
22.7
1.5
1.2
28.2
28.7
1.7
1.3
MEP Infra
Neutral
40
-
654
1,877
1,943
30.6
29.8
3.0
4.2
13.4
9.6
6.5
4.4
0.6
0.6
1.7
1.6
Stock Watch
January 06, 2017
Company Name
Reco
CMP
Target
Mkt Cap
Sales ( Čcr )
OPM(%)
EPS (Č)
PER(x)
P/BV(x)
RoE(%)
EV/Sales(x)
(Č)
Price ( Č)
( Č cr )
FY17E
FY18E
FY17E
FY18E
FY17E
FY18E
FY17E
FY18E
FY17E
FY18E
FY17E
FY18E
FY17E
FY18E
Construction
SIPL
Neutral
98
-
3,455
1,036
1,252
65.5
66.2
(8.4)
(5.6)
3.7
4.2
(22.8)
(15.9)
11.6
9.6
Engineers India
Neutral
155
-
10,442
1,725
1,935
16.0
19.1
11.4
13.9
13.6
11.2
1.9
1.8
13.4
15.3
5.0
4.5
Financials
Axis Bank
Buy
458
630
109,497
46,932
53,575
3.5
3.4
32.4
44.6
14.2
10.3
1.8
1.6
13.6
16.5
-
-
Bank of Baroda
Neutral
151
-
34,724
19,980
23,178
1.8
1.8
11.5
17.3
13.1
8.7
1.5
1.2
8.3
10.1
-
-
Canara Bank
Neutral
266
-
14,457
15,225
16,836
1.8
1.8
14.5
28.0
18.4
9.5
1.3
1.0
5.8
8.5
-
-
Dewan Housing Finance Buy
247
350
7,748
2,225
2,688
2.9
2.9
29.7
34.6
8.3
7.2
1.3
1.2
16.1
16.8
-
-
Equitas Holdings
Buy
150
235
5,034
939
1,281
11.7
11.5
5.8
8.2
25.9
18.3
2.2
2.0
10.9
11.5
-
-
Federal Bank
Buy
68
85
11,623
8,259
8,995
3.0
3.0
4.3
5.6
15.7
12.1
1.3
1.2
8.5
10.1
-
-
HDFC
Neutral
1,217
-
192,811
11,475
13,450
3.4
3.4
45.3
52.5
26.9
23.2
5.2
4.6
20.2
20.5
-
-
HDFC Bank
Accumulate
1,183
1,350
302,134
46,097
55,433
4.5
4.5
58.4
68.0
20.3
17.4
3.6
3.0
18.8
18.6
-
-
ICICI Bank
Buy
257
315
149,674
42,800
44,686
3.1
3.3
18.0
21.9
14.3
11.7
1.9
1.8
11.1
12.3
-
-
Lakshmi Vilas Bank
Buy
138
174
2,643
3,339
3,799
2.7
2.8
11.0
14.0
12.6
9.9
1.3
1.2
11.2
12.7
-
-
LIC Housing Finance
Buy
523
630
26,391
3,712
4,293
2.6
2.5
39.0
46.0
13.4
11.4
2.5
2.2
19.9
20.1
-
-
Punjab Natl.Bank
Neutral
118
-
25,036
23,532
23,595
2.3
2.4
6.8
12.6
17.3
9.3
2.7
1.9
3.3
6.5
-
-
RBL Bank
Neutral
354
-
13,089
1,783
2,309
2.6
2.6
12.7
16.4
27.9
21.6
3.0
2.7
12.8
13.3
-
-
South Ind.Bank
Neutral
21
-
2,771
6,435
7,578
2.5
2.5
2.7
3.1
7.6
6.6
1.0
0.8
10.1
11.2
-
-
St Bk of India
Neutral
245
-
190,537
88,650
98,335
2.6
2.6
13.5
18.8
18.2
13.1
1.7
1.5
7.0
8.5
-
-
Union Bank
Neutral
128
-
8,796
13,450
14,925
2.3
2.3
25.5
34.5
5.0
3.7
0.7
0.6
7.5
10.2
-
-
Yes Bank
Neutral
1,210
-
51,162
8,978
11,281
3.3
3.4
74.0
90.0
16.4
13.4
3.1
2.6
17.0
17.2
-
-
FMCG
Asian Paints
Neutral
916
-
87,906
17,128
18,978
16.8
16.4
19.1
20.7
48.0
44.3
16.7
15.8
34.8
35.5
5.1
4.6
Britannia
Buy
2,867
3,626
34,407
9,594
11,011
14.6
14.9
80.3
94.0
35.7
30.5
14.7
11.3
41.2
-
3.4
3.0
Colgate
Accumulate
897
995
24,400
4,605
5,149
23.4
23.4
23.8
26.9
37.7
33.4
20.9
16.3
64.8
66.8
5.2
4.7
Dabur India
Accumulate
279
304
49,094
8,315
9,405
19.8
20.7
8.1
9.2
34.4
30.3
9.6
7.9
31.6
31.0
5.6
4.9
GlaxoSmith Con*
Neutral
5,143
-
21,629
4,350
4,823
21.2
21.4
179.2
196.5
28.7
26.2
7.6
6.5
27.1
26.8
4.4
3.8
Godrej Consumer
Neutral
1,525
-
51,933
10,235
11,428
18.4
18.6
41.1
44.2
37.1
34.5
8.2
6.9
24.9
24.8
5.2
4.6
HUL
Neutral
832
-
180,122
35,252
38,495
17.8
17.8
20.7
22.4
40.3
37.2
38.5
33.0
95.6
88.9
5.0
4.5
ITC
Buy
247
284
298,792
40,059
44,439
38.3
39.2
9.0
10.1
27.5
24.3
7.7
6.7
27.8
27.5
7.0
6.3
Marico
Buy
261
300
33,631
6,430
7,349
18.8
19.5
6.4
7.7
40.7
33.9
12.3
10.3
33.2
32.5
5.0
4.4
Nestle*
Neutral
5,909
-
56,971
10,073
11,807
20.7
21.5
124.8
154.2
47.4
38.3
19.4
17.5
34.8
36.7
5.5
4.6
Stock Watch
January 06, 2017
Company Name
Reco
CMP
Target
Mkt Cap
Sales ( Čcr )
OPM(%)
EPS (Č)
PER(x)
P/BV(x)
RoE(%)
EV/Sales(x)
(Č)
Price ( Č)
( Č cr )
FY17E FY18E
FY17E
FY18E
FY17E
FY18E
FY17E
FY18E
FY17E
FY18E
FY17E
FY18E
FY17E
FY18E
FMCG
Tata Global
Neutral
125
-
7,902
8,675
9,088
9.8
9.8
7.4
8.2
16.9
15.3
1.9
1.8
7.9
8.1
0.8
0.8
Procter & Gamble
Accumulate
6,942
7,369
22,535
2,939
3,342
23.2
23.0
146.2
163.7
47.5
42.4
106.3
101.9
25.3
23.5
7.2
6.3
Hygiene
IT
HCL Tech^
Buy
844
1,000
119,116
49,242
57,168
20.5
20.5
55.7
64.1
15.2
13.2
3.1
2.4
20.3
17.9
2.3
1.9
Infosys
Buy
996
1,249
228,868
68,350
77,326
27.0
27.0
62.5
69.4
15.9
14.4
3.4
3.1
21.3
21.6
2.8
2.4
TCS
Accumulate
2,335
2,620
460,006
119,025
133,308
27.6
27.6
131.2
145.5
17.8
16.0
5.8
5.3
32.4
33.1
3.6
3.2
Tech Mahindra
Buy
488
600
47,518
29,673
32,937
15.5
17.0
32.8
39.9
14.9
12.2
2.9
2.5
19.6
20.7
1.3
1.1
Wipro
Buy
480
590
116,767
55,440
60,430
18.1
18.1
35.9
39.9
13.4
12.0
2.4
2.2
19.0
19.3
1.8
1.7
Media
D B Corp
Neutral
371
-
6,820
2,297
2,590
27.4
28.2
21.0
23.4
17.7
15.9
4.1
3.6
23.7
23.1
2.8
2.4
HT Media
Neutral
77
-
1,783
2,693
2,991
12.6
12.9
7.9
9.0
9.7
8.5
0.8
0.8
7.8
8.3
0.2
0.1
Jagran Prakashan
Buy
177
225
5,799
2,355
2,635
28.0
28.0
10.8
12.5
16.4
14.2
3.6
3.1
21.7
21.7
2.5
2.2
Sun TV Network
Neutral
532
-
20,969
2,850
3,265
70.1
71.0
26.2
30.4
20.3
17.5
5.2
4.6
24.3
25.6
7.0
5.9
Hindustan Media
Neutral
271
-
1,985
1,016
1,138
24.3
25.2
27.3
30.1
9.9
9.0
1.9
1.7
16.2
15.8
1.3
1.1
Ventures
TV Today Network
Buy
283
385
1,688
637
743
27.5
27.5
18.4
21.4
15.4
13.2
2.7
2.3
17.4
17.2
2.3
1.8
Metals & Mining
Coal India
Neutral
308
-
191,281
84,638
94,297
21.4
22.3
24.5
27.1
12.6
11.4
5.2
5.0
42.6
46.0
1.8
1.6
Hind. Zinc
Neutral
262
-
110,577
14,252
18,465
55.9
48.3
15.8
21.5
16.6
12.2
2.7
2.4
17.0
20.7
7.8
6.0
Hindalco
Neutral
162
-
33,461
107,899
112,095
7.4
8.2
9.2
13.0
17.6
12.5
0.9
0.8
4.8
6.6
0.8
0.8
JSW Steel
Neutral
176
-
42,471
53,201
58,779
16.1
16.2
130.6
153.7
1.4
1.1
0.2
0.2
14.0
14.4
1.6
1.4
NMDC
Neutral
135
-
42,554
6,643
7,284
44.4
47.7
7.1
7.7
18.9
17.5
1.6
1.6
8.8
9.2
4.2
3.8
SAIL
Neutral
52
-
21,456
47,528
53,738
(0.7)
2.1
(1.9)
2.6
20.0
0.6
0.5
(1.6)
3.9
1.3
1.2
Vedanta
Neutral
228
-
67,491
71,744
81,944
19.2
21.7
13.4
20.1
17.0
11.3
1.5
1.3
8.4
11.3
1.3
1.0
Tata Steel
Neutral
419
-
40,708
121,374
121,856
7.2
8.4
18.6
34.3
22.5
12.2
1.4
1.3
6.1
10.1
1.0
1.0
Oil & Gas
Cairn India
Neutral
254
-
47,647
9,127
10,632
4.3
20.6
8.8
11.7
28.9
21.7
0.9
0.9
3.3
4.2
6.7
5.6
GAIL
Neutral
442
-
56,054
56,220
65,198
9.3
10.1
27.1
33.3
16.3
13.3
1.5
1.4
9.3
10.7
1.2
1.0
ONGC
Neutral
200
-
256,216
137,222
152,563
15.0
21.8
19.5
24.1
10.2
8.3
0.9
0.8
8.5
10.1
2.1
1.9
Indian Oil Corp
Neutral
353
-
171,195
373,359
428,656
5.9
5.5
54.0
59.3
6.5
6.0
1.0
0.9
16.0
15.6
0.6
0.5
Reliance Industries
Neutral
1,077
-
349,465
301,963
358,039
12.1
12.6
87.7
101.7
12.3
10.6
1.3
1.1
10.7
11.3
1.6
1.4
Pharmaceuticals
Alembic Pharma
Neutral
605
-
11,405
3,483
4,083
20.2
21.4
24.3
30.4
24.9
19.9
5.7
4.5
25.5
25.3
3.2
2.7
Alkem Laboratories Ltd
Buy
1,662
1,989
19,871
6,043
6,893
18.7
19.3
80.5
88.8
20.7
18.7
4.6
3.8
22.3
20.3
3.2
2.8
Aurobindo Pharma
Buy
686
877
40,125
15,720
18,078
23.7
23.7
41.4
47.3
16.6
14.5
4.3
3.4
29.6
26.1
2.8
2.4
Stock Watch
January 06, 2017
Company Name
Reco
CMP
Target
Mkt Cap
Sales ( Čcr )
OPM(%)
EPS (Č)
PER(x)
P/BV(x)
RoE(%)
EV/Sales(x)
(Č)
Price ( Č)
( Č cr )
FY17E FY18E
FY17E
FY18E
FY17E
FY18E
FY17E
FY18E
FY17E
FY18E
FY17E
FY18E
FY17E
FY18E
Pharmaceuticals
Aventis*
Neutral
4,235
-
9,755
2,277
2,597
17.3
18.3
149.4
172.0
28.4
24.6
4.7
3.8
25.1
28.8
4.0
3.2
Cadila Healthcare
Accumulate
366
400
37,464
10,429
12,318
22.6
22.0
16.9
19.2
21.7
19.1
5.5
4.4
28.5
25.7
3.6
2.9
Cipla
Sell
580
490
46,627
15,378
18,089
17.4
18.4
21.6
27.2
26.8
21.3
3.5
3.0
13.7
15.2
3.2
2.7
Dr Reddy's
Neutral
3,136
-
51,954
16,043
18,119
20.8
22.4
112.4
142.9
27.9
22.0
3.7
3.3
14.1
15.9
3.2
2.8
Dishman Pharma
Neutral
230
-
3,709
1,718
1,890
22.7
22.8
9.5
11.3
24.2
20.3
2.3
2.1
10.1
10.9
2.6
2.3
GSK Pharma*
Neutral
2,728
-
23,110
3,000
3,312
15.4
20.6
46.5
60.8
58.7
44.9
14.1
14.0
26.3
30.6
7.4
6.8
Indoco Remedies
Reduce
270
240
2,491
1,112
1,289
16.2
18.2
11.6
16.0
23.3
16.9
3.7
3.1
17.0
20.1
2.4
2.0
Ipca labs
Accumulate
549
613
6,930
3,303
3,799
15.3
15.3
17.3
19.7
31.8
27.9
2.8
2.5
9.1
9.4
2.2
1.9
Lupin
Buy
1,511
1,809
68,215
15,912
18,644
26.4
26.7
58.1
69.3
26.0
21.8
5.1
4.2
21.4
20.9
4.4
3.6
Sun Pharma
Buy
643
847
154,329
31,129
35,258
32.0
32.9
30.2
35.3
21.3
18.2
3.5
2.9
20.0
20.1
4.5
3.8
Power
Tata Power
Neutral
77
-
20,785
36,916
39,557
17.4
27.1
5.1
6.3
15.1
12.2
1.3
1.2
9.0
10.3
1.6
1.4
NTPC
Neutral
165
-
135,844
86,605
95,545
17.5
20.8
11.8
13.4
14.0
12.3
1.4
1.3
10.5
11.1
2.9
2.9
Power Grid
Buy
191
223
99,819
25,315
29,193
88.2
88.7
14.2
17.2
13.5
11.1
2.0
1.8
15.2
16.1
8.6
7.7
Real Estate
Prestige Estate
Buy
174
210
6,512
4,707
5,105
25.2
26.0
10.3
13.0
16.9
13.4
1.4
1.3
10.3
10.2
2.6
2.3
MLIFE
Buy
362
522
1,485
1,152
1,300
22.7
24.6
29.9
35.8
12.1
10.1
0.9
0.8
7.6
8.6
2.0
1.7
Telecom
Bharti Airtel
Neutral
321
-
128,377
105,086
114,808
34.5
34.7
12.2
16.4
26.3
19.6
1.8
1.7
6.8
8.4
2.1
1.9
Idea Cellular
Neutral
75
-
26,902
40,133
43,731
37.2
37.1
6.4
6.5
11.7
11.5
1.0
0.9
8.2
7.6
1.7
1.4
zOthers
Abbott India
Neutral
4,600
-
9,775
3,153
3,583
14.1
14.4
152.2
182.7
30.2
25.2
148.4
126.7
25.6
26.1
2.8
2.4
Asian Granito
Buy
242
351
729
1,071
1,182
12.1
12.4
12.7
16.0
19.0
15.2
1.8
1.6
9.5
10.7
1.0
0.9
Bajaj Electricals
Buy
232
274
2,348
4,801
5,351
5.7
6.2
10.4
13.7
22.3
17.0
2.8
2.5
12.4
14.5
0.5
0.4
Banco Products (India)
Neutral
204
-
1,461
1,353
1,471
12.3
12.4
14.5
16.3
14.1
12.5
19.5
17.5
14.5
14.6
1.0
109.4
Coffee Day Enterprises
Neutral
199
-
4,096
2,964
3,260
20.5
21.2
4.7
8.0
-
24.9
2.3
2.1
5.5
8.5
1.8
1.6
Ltd
Competent Automobiles Neutral
163
-
100
1,137
1,256
3.1
2.7
28.0
23.6
5.8
6.9
31.4
28.3
14.3
11.5
0.1
0.1
Elecon Engineering
Neutral
58
-
650
1,482
1,660
13.7
14.5
3.9
5.8
14.9
10.0
3.5
3.2
7.8
10.9
0.8
0.7
Finolex Cables
Neutral
415
-
6,348
2,883
3,115
12.0
12.1
14.2
18.6
29.2
22.3
15.5
13.6
15.8
14.6
1.9
1.7
Garware Wall Ropes
Neutral
615
-
1,345
873
938
14.3
14.3
35.2
37.5
17.5
16.4
3.1
2.6
17.5
15.9
1.5
1.3
Goodyear India*
Neutral
726
-
1,675
1,598
1,704
10.4
10.2
49.4
52.6
14.7
13.8
67.9
59.5
18.2
17.0
0.7
102.1
Hitachi
Neutral
1,382
-
3,759
2,081
2,433
8.8
8.9
33.4
39.9
41.4
34.7
33.4
27.8
22.1
21.4
1.8
1.5
HSIL
Neutral
284
-
2,055
2,384
2,515
15.8
16.3
15.3
19.4
18.6
14.7
18.5
15.9
7.8
9.3
1.0
0.9
Stock Watch
January 06, 2017
Company Name
Reco
CMP
Target
Mkt Cap
Sales ( Čcr )
OPM(%)
EPS (Č)
PER(x)
P/BV(x)
RoE(%)
EV/Sales(x)
(Č)
Price ( Č)
( Č cr )
FY17E
FY18E
FY17E
FY18E
FY17E
FY18E
FY17E
FY18E
FY17E
FY18E
FY17E
FY18E
FY17E
FY18E
zOthers
Interglobe Aviation
Neutral
842
-
30,430
21,122
26,005
14.5
27.6
110.7
132.1
7.6
6.4
45.5
32.5
168.5
201.1
1.4
1.1
Jyothy Laboratories
Neutral
334
-
6,074
1,440
2,052
11.5
13.0
8.5
10.0
39.4
33.5
9.5
8.8
18.6
19.3
4.5
3.1
Kirloskar Engines India
Neutral
338
-
4,884
2,554
2,800
9.9
10.0
10.5
12.1
32.2
27.9
13.5
12.7
10.7
11.7
1.6
1.4
Ltd
Linc Pen & Plastics
Neutral
231
-
342
382
420
9.3
9.5
13.5
15.7
17.2
14.7
2.9
2.5
17.1
17.3
1.0
0.9
M M Forgings
Neutral
446
-
538
546
608
20.4
20.7
41.3
48.7
10.8
9.2
61.1
54.1
16.6
17.0
0.8
0.7
Manpasand Bever.
Neutral
550
-
3,147
836
1,087
19.6
19.4
16.9
23.8
32.6
23.1
3.9
3.4
12.0
14.8
3.5
2.6
Mirza International
Buy
93
107
1,117
987
1,106
18.0
18.0
6.5
7.6
14.2
12.2
2.3
1.9
15.9
15.7
1.3
1.2
MT Educare
Neutral
127
-
505
366
417
17.7
18.2
9.4
10.8
13.5
11.7
3.0
2.6
22.2
22.3
1.3
1.1
Narayana Hrudaya
Neutral
340
-
6,941
1,873
2,166
11.5
11.7
2.6
4.0
128.4
85.7
7.9
7.1
6.1
8.3
3.8
3.3
Navkar Corporation
Buy
174
265
2,480
369
561
42.9
42.3
7.2
11.5
24.1
15.1
1.8
1.6
7.4
10.5
7.7
5.1
Navneet Education
Neutral
120
-
2,866
1,062
1,147
24.0
24.0
6.1
6.6
19.8
18.2
4.1
3.6
20.6
19.8
2.8
2.6
Nilkamal
Neutral
1,429
-
2,133
1,995
2,165
10.7
10.4
69.8
80.6
20.5
17.7
81.7
70.9
16.6
16.5
1.1
0.9
Page Industries
Neutral
13,820
-
15,415
2,450
3,124
20.1
17.6
299.0
310.0
46.2
44.6
307.8
235.0
47.1
87.5
6.3
5.0
Parag Milk Foods
Neutral
263
-
2,210
1,919
2,231
9.3
9.6
9.5
12.9
27.8
20.3
4.3
3.6
15.5
17.5
1.3
1.1
Quick Heal
Neutral
268
-
1,878
408
495
27.3
27.0
7.7
8.8
34.6
30.5
3.2
3.2
9.3
10.6
3.7
3.1
Radico Khaitan
Buy
122
147
1,626
1,667
1,824
13.0
13.2
6.7
8.2
18.4
14.9
1.7
1.5
9.0
10.2
1.4
1.2
Relaxo Footwears
Neutral
402
-
4,824
2,085
2,469
9.2
8.2
7.6
8.0
53.1
50.5
20.6
17.6
17.9
18.8
2.4
2.1
S H Kelkar & Co.
Neutral
324
-
4,681
1,036
1,160
15.1
15.0
6.1
7.2
53.0
45.1
5.7
5.2
10.7
11.5
4.4
3.9
Siyaram Silk Mills
Accumulate
1,400
1,605
1,312
1,733
1,948
11.6
11.7
96.6
114.7
14.5
12.2
2.2
1.9
15.3
15.7
1.0
0.9
Styrolution ABS India*
Neutral
607
-
1,068
1,440
1,537
9.2
9.0
40.6
42.6
15.0
14.3
38.2
34.7
12.3
11.6
0.7
0.6
Surya Roshni
Neutral
183
-
802
3,342
3,625
7.8
7.5
17.3
19.8
10.6
9.3
20.1
16.1
10.5
10.8
0.5
0.4
Team Lease Serv.
Neutral
895
-
1,531
3,229
4,001
1.5
1.8
22.8
32.8
39.3
27.3
4.2
3.7
10.7
13.4
0.4
0.3
The Byke Hospitality
Neutral
170
-
683
287
384
20.5
20.5
7.6
10.7
22.4
15.9
4.7
3.8
20.7
23.5
2.4
1.8
Transport Corporation of
Neutral
155
-
1,184
2,671
2,911
8.5
8.8
13.9
15.7
11.2
9.9
1.5
1.4
13.7
13.8
0.5
0.5
India
TVS Srichakra
Neutral
3,267
-
2,502
2,304
2,614
13.7
13.8
231.1
266.6
14.1
12.3
367.1
289.0
33.9
29.3
1.1
0.9
UFO Moviez
Neutral
418
-
1,154
619
685
33.2
33.4
30.0
34.9
14.0
12.0
1.9
1.7
13.8
13.9
1.6
1.2
Visaka Industries
Neutral
195
-
309
1,051
1,138
10.3
10.4
21.0
23.1
9.3
8.4
25.0
23.4
9.0
9.2
0.6
0.5
VRL Logistics
Neutral
266
-
2,430
1,902
2,119
16.7
16.6
14.6
16.8
18.3
15.8
4.0
3.5
21.9
22.2
1.4
1.2
Wonderla Holidays
Neutral
344
-
1,944
287
355
38.0
40.0
11.3
14.2
30.5
24.2
4.4
3.8
21.4
23.9
6.5
5.2
Source: Company, Angel Research; Note: *December year end; #September year end; &October year end; Price as on January 05, 2017
Market Outlook
January 06, 2017
Research Team Tel: 022 - 39357800
DISCLAIMER
Angel Broking Private Limited (hereinafter referred to as “Angel”) is a registered Member of National Stock Exchange of India Limited,
Bombay Stock Exchange Limited and Metropolitan Stock Exchange Limited. It is also registered as a Depository Participant with CDSL
and Portfolio Manager with SEBI. It also has registration with AMFI as a Mutual Fund Distributor. Angel Broking Private Limited is a
registered entity with SEBI for Research Analyst in terms of SEBI (Research Analyst) Regulations, 2014 vide registration number
INH000000164. Angel or its associates has not been debarred/ suspended by SEBI or any other regulatory authority for accessing
/dealing in securities Market. Angel or its associates/analyst has not received any compensation / managed or co-managed public
offering of securities of the company covered by Analyst during the past twelve months.
This document is solely for the personal information of the recipient, and must not be singularly used as the basis of any investment
decision. Nothing in this document should be construed as investment or financial advice. Each recipient of this document should make
such investigations as they deem necessary to arrive at an independent evaluation of an investment in the securities of the companies
referred to in this document (including the merits and risks involved), and should consult their own advisors to determine the merits and
risks of such an investment.
Reports based on technical and derivative analysis center on studying charts of a stock's price movement, outstanding positions and
trading volume, as opposed to focusing on a company's fundamentals and, as such, may not match with a report on a company's
fundamentals. Investors are advised to refer the Fundamental and Technical Research Reports available on our website to evaluate the
contrary view, if any.
The information in this document has been printed on the basis of publicly available information, internal data and other reliable
sources believed to be true, but we do not represent that it is accurate or complete and it should not be relied on as such, as this
document is for general guidance only. Angel Broking Pvt. Limited or any of its affiliates/ group companies shall not be in any way
responsible for any loss or damage that may arise to any person from any inadvertent error in the information contained in this report.
Angel Broking Pvt. Limited has not independently verified all the information contained within this document. Accordingly, we cannot
testify, nor make any representation or warranty, express or implied, to the accuracy, contents or data contained within this document.
While Angel Broking Pvt. Limited endeavors to update on a reasonable basis the information discussed in this material, there may be
regulatory, compliance, or other reasons that prevent us from doing so.
This document is being supplied to you solely for your information, and its contents, information or data may not be reproduced,
redistributed or passed on, directly or indirectly.
Neither Angel Broking Pvt. Limited, nor its directors, employees or affiliates shall be liable for any loss or damage that may arise from
or in connection with the use of this information.